

Answer this question to guide trades…
In every trader’s career, there are universal questions that we’ll all need to answer for ourselves. These include, “What time frames do we even focus on?” and, “Do we use multiple time frame confirmation?”
As I go through this, there’s no right or wrong answer.
What I’m going to share with you is my journey to where I am right now, in terms of mastering time frames for the way I like to trade.
My goal is that this can get you pointed in the right direction and allow you to take advantage of my decades of trial and error.
So let’s get into it.
How do we manage time frames and which time frames do we use for our trading and even investing decisions? There are two layouts that I’ll use. One layout is for day trading and the other for swing trading — being in longer time frames (days to weeks) and even investing (trades that I could potentially stay in for months and years ahead).
For day trading time frames, I will look at the two-minute and five-minute, along with the one-year and then the daily.
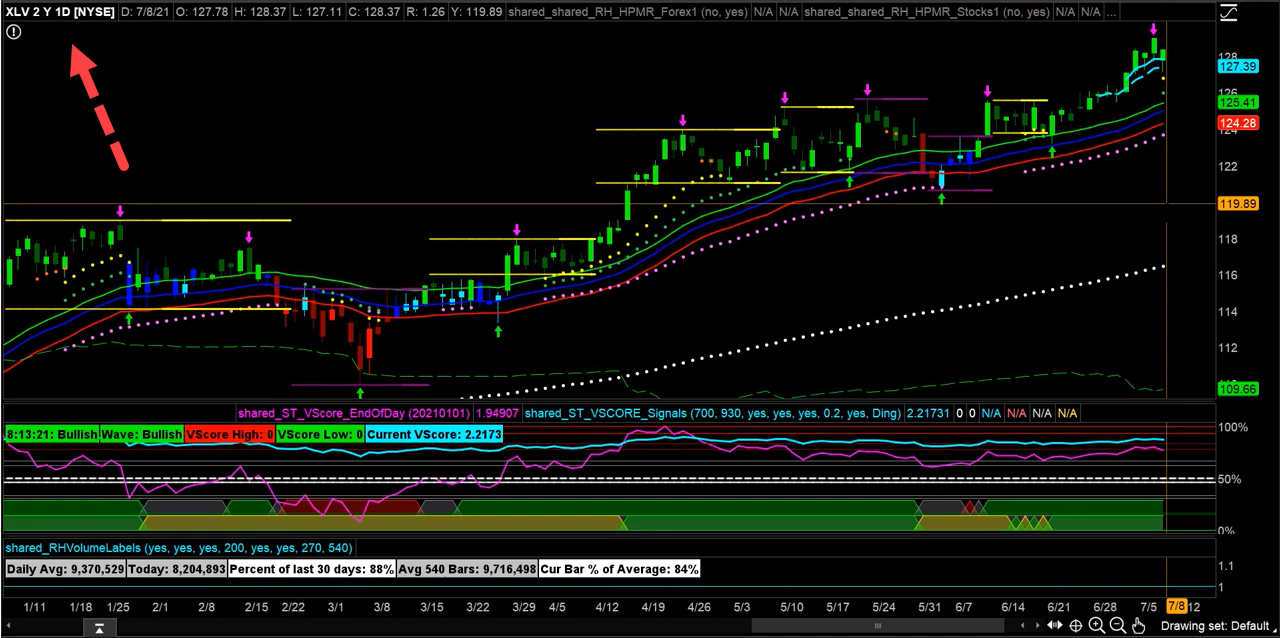
The daily is really for every trader — the day trader, swing trader, and even investor.
The daily is really the touchstone for everything that you’d want to understand about the broadest, most impactful market psychology. In other words, trends on the daily are the trends that the widest group of traders and investors should be looking at to understand how the market is moving in their favor or not in their favor.
Countdown Fun Fact: Trends on the daily are also known as the end-of-day time frame.
Bullishly, bearishly… we all look at the end-of-day price, which is what leads us to the daily time frame chart. Whether you’re a day trader or whether you’re a longer term investor — and everything in the middle — the trend on the daily or a lack of trend on the daily is going to tell you a lot about the psychology that is ruling the market.
So, now that we understand the value and the need for every trader to look at the daily time frame, let’s go back and talk about the time frames I use for day trading.
The chart layout I have found that works best for day trading is the two-minute, five-minute and the daily (see image below).
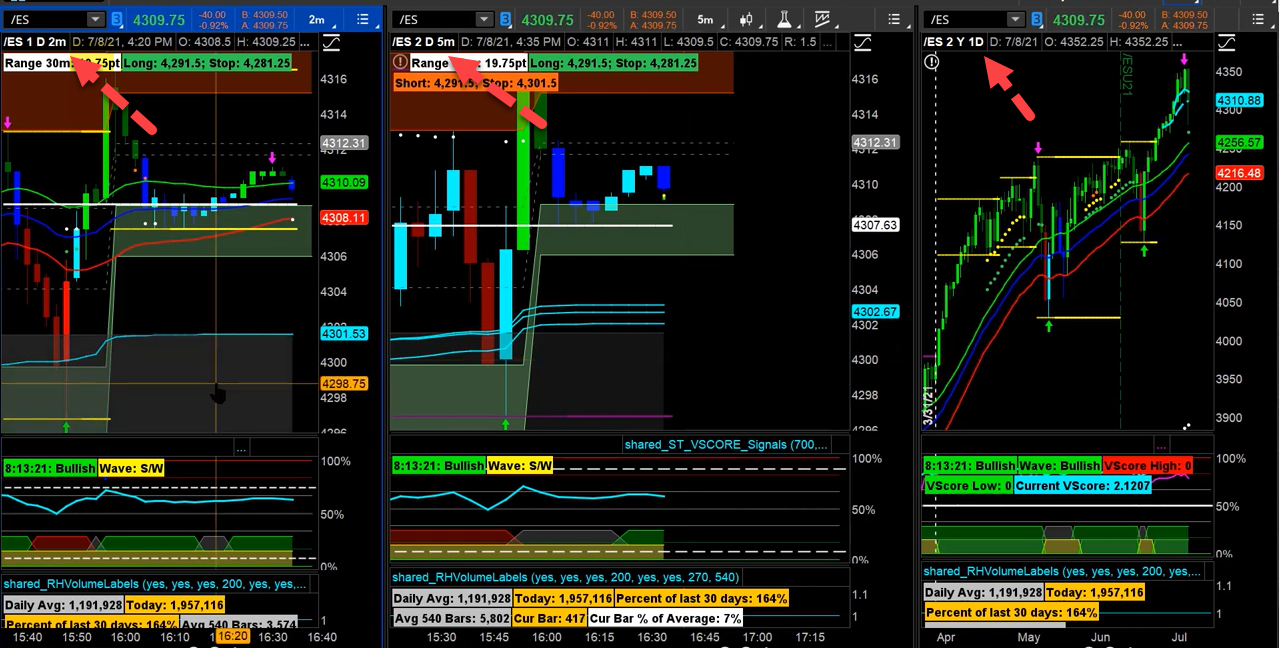
Let’s look at the time frames.
The two-minute helps me understand what’s happening in the markets. I know that my two-minute time frame can give me insight into the five-minute when I’m day trading.
The five-minute time frame is ideal for identifying the intricacies of understanding how you’re going to get filled, or the precision that you need to execute an order. The five-minute is going to give me the understanding of how to get filled.
While I track it, I am not making entry decisions based on the two-minute. However, if there’s a pattern that’s forming on the five-minute, and I want to confirm it more aggressively — a little bit more quickly — the two-minute is a great tool for this fast confirmation. My decisions for day trading are being made from a five-minute chart.
Now let’s talk about swing trades (days to weeks) and longer term investments (months to years). Again, the daily time frame is key regardless of what time frame you’re trading.
Always start with the daily.
I then add to my layout the weekly.
The weekly is valuable to traders looking at a daily time frame because when a daily gets choppy it is in the weekly that we can see what’s happening with the trend. Is there still a trend when the daily is choppy? The weekly will answer that question.

The weekly gives you a bearing if you feel like the daily is reacting as if it’s on the open seas, and you’re getting a little seasick.
The skipper will tell you to look at the horizon, right? Because looking further away, looking across the water to the horizon, it sort of evens everything out, and you’re not so caught up in all the tossing and turning on the boat that you’re on.
Think of the weekly chart as “looking out at the horizon” when the daily gets a little messy and into choppy market conditions. This is why I add the weekly for an investor type approach.
My decisions for following larger trends are being made on a daily time frame with some help from the weekly time frame.
Ok, that sounds great, but what about the other time frames — especially when it comes to day trading?
I also get asked, “What about the 15-minute,the 30-minute, and the 60-minute? I hear so many people using those time frames and there’s nothing wrong with that.
If you’re more comfortable with any of these longer time frames, let the shorter, 15-minute time frame be the more aggressive, quicker confirmation time frame.
In other words, you can use the shorter term time frame to aggressively confirm a longer term time frame. If you like the 60-minute time frame, maybe use the 30-minute or15-minute time frame to confirm setups on the 60-minute.
Please know there’s no magic time frame: One is not inherently better than another.
There are always advantages and trade-offs. Be as clear as you can with what you are looking for in a trade and the time frame decision is easier.
