

Through the eyes of a futures trader…
I hear this so often, “I don’t trade futures.”
Well, you kind of do even though you don’t realize it. Think of the indices — the Dow, Nasdaq, Russell, and the S&P. They’re all made up of some of the most common stocks everyone trades, especially through options. Let’s look at a recent day trade from this week.
We started by looking at the Dow…
Finding direction…
For those of you familiar with my Volume Weighted Average Price (VWAP) tool, isn’t the goal to identify the VWAP directional bias? For those traders not familiar with my tools, the VWAP is about measuring volume. What direction the volume is going, if you will.
It was easily and clearly bullish on the Dow (below):
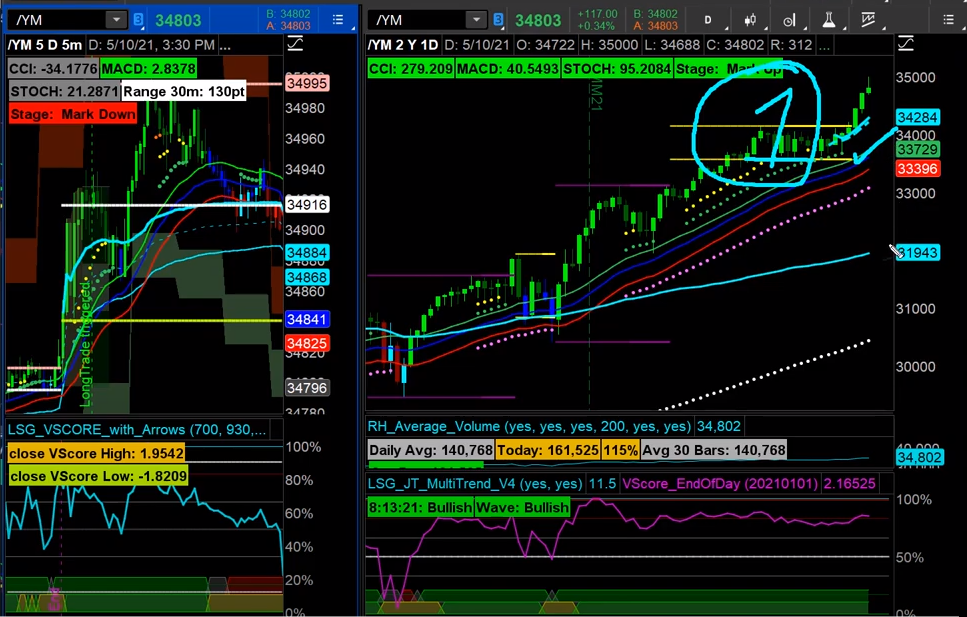
Looking at the E-mini Dow (YM) chart below, we got our zone of entry at 10 a.m. A nice little trade for us in terms of heading to that 35,000 initial test of that major psychological level. We know that major psychological levels of new highs have not been easy or one-and-done types of breaks.

2020 is behind us…
We aren’t talking about 2020 higher-highs, but rather the trades that I’m taking and results that I’m getting now. This is a very different market in 2021and this isn’t the parabolic uptrend of last year. That’s great, but, “I don’t trade futures,” so how does all this apply to me as an options trader?
Let’s take a look at things through the Dow and the consumer staples exchange traded fund (ETF) – XLP.
What we’re doing in trading options is a very similar setup to the trade we took above in the Dow, but through XLP options. So, here’s a chart of the Dow (YM) where we see the day trading setup that we just spoke of earlier (next image).

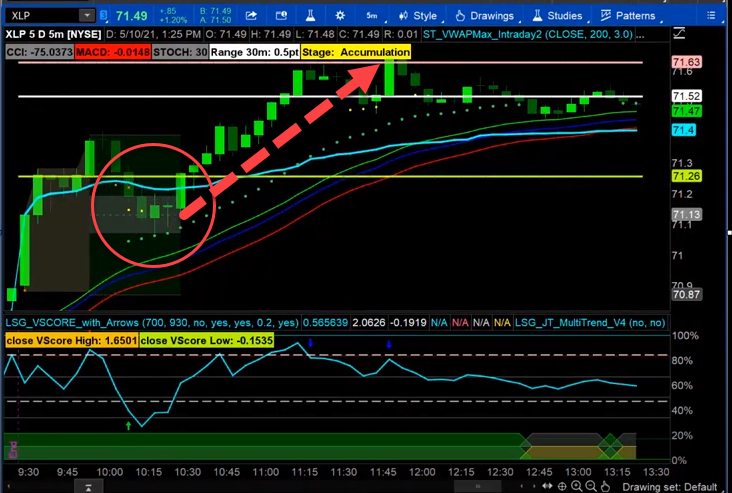
Now, take a look below at the XLP…
Notice that the opportunity for a great setup is the same as the Dow (YM) chart above. You could take the same futures trade through an ETF option.
Those are the examples of the XLP and the Dow. Let’s take a look at another market, the financial select (XLF) ETF for example (below).
The XLF covers the financials which are heavily weighted within the Dow. I’m able to take advantage of something that has the clarity of the upturn in the Dow and excellent clarity of its own breach retreat (aka simple day trade buy).

Finally the healthcare (XLV) ETF has been overlooked in many ways. Healthcare is pretty significantly weighted within the Dow. Once again, we had a great opportunity for a day trade set up in the XLV (below) at the same zone within an uptrend as all of the previous examples.

Whether you took the day trade through a futures contract or options via the XLP, XLF, or XLV, we’re able to take advantage of and profit from taking a long position. For those of you wondering, the squiggle on the bottom of the charts is the VScore which is part of my VWAP tools.

Price is only part of the analysis…
That’s a conversation for another time, but keep a lookout for my daytrading class coming up at the end June. We’ll be talking about “everything” daytrading.
For our conversation here today, the bottom line is that if you traded with the Dow options, the Dow futures, the micro Dow, or any of the options alternatives then you were taking advantage of the clarity in certain pockets of the market.
You just need someone to show you where to look.
