

One of my favorite trades is to be on the opposite side of panic because panic has a way of “sucker-ing” traders into bad positions. On the flip side (the side that’s gonna’ work for us as I show you here) of panic is often going to be a fantastic opportunity as extreme emotion typically does not have the ability to follow through.
So let’s take a look at this chart (below) of the Dow…
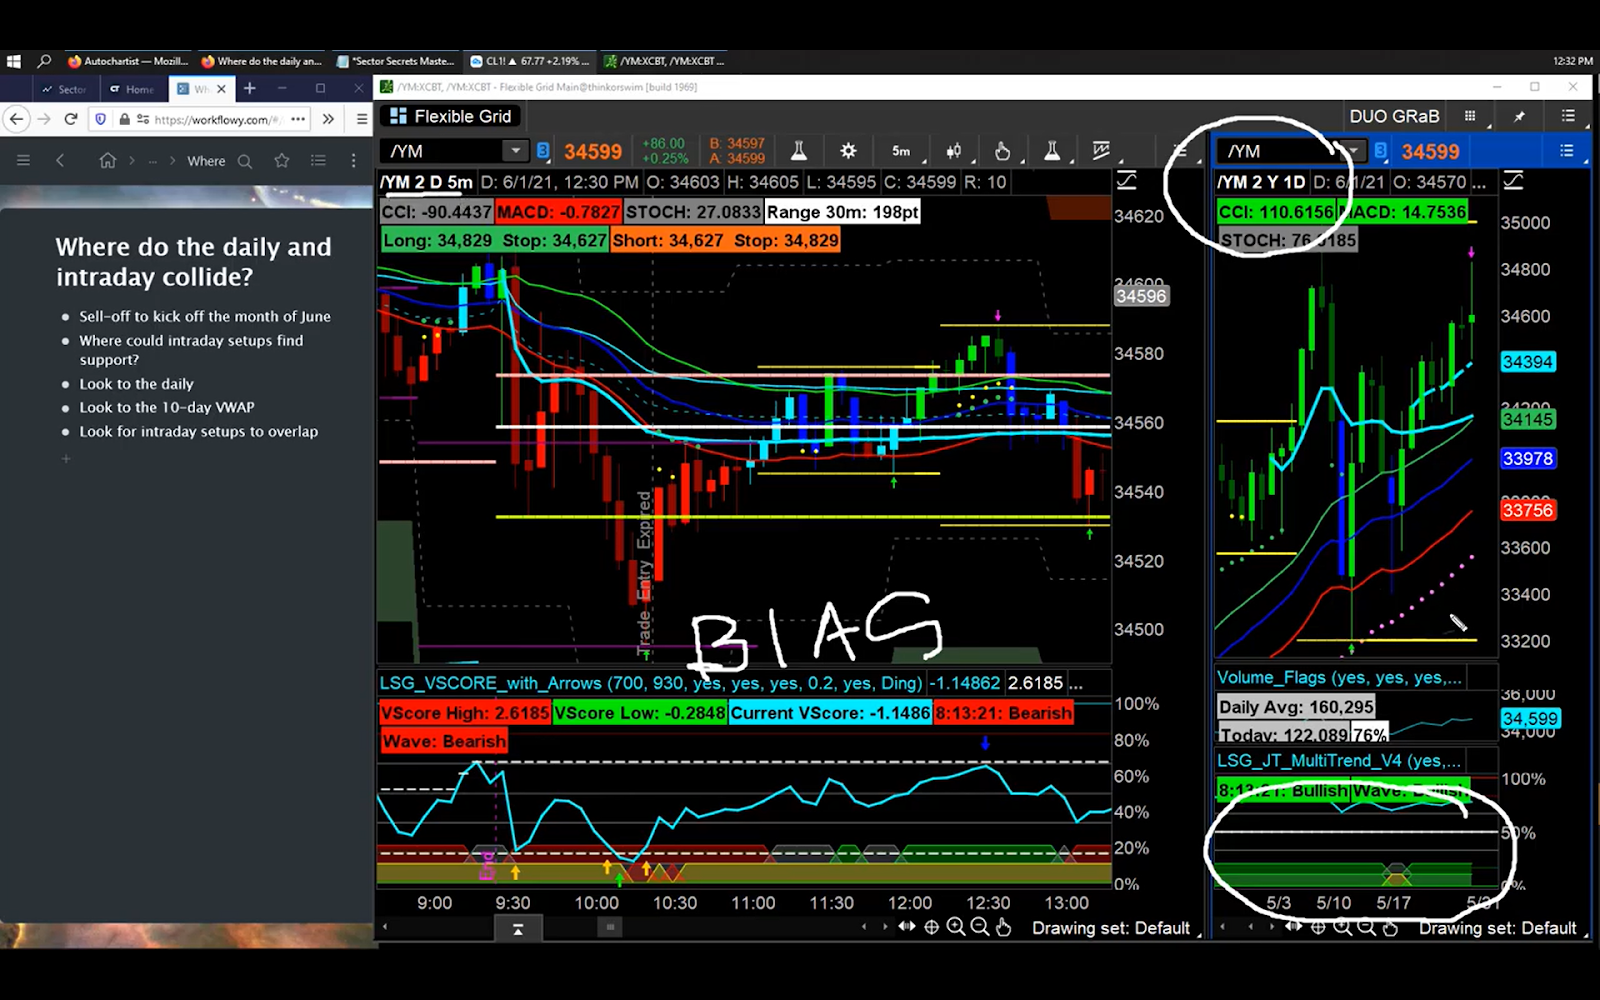
The big question is, where do daily and intraday time frames collide? Now, before we even get to the intraday chart, one of the hallmarks or reasons I’ve been a successful day trader is because I don’t ignore the daily time frame. I look at the daily structure to give me what I call “directional bias.” In other words, for me, directional bias means I am only going to trade in one direction.
I’m not gonna’ play back-and-forth-back-and-orth, I’m gonna’ look for a very specific opportunity.
This is what I call a pitch.
And when the pitch is in the right place for us to take advantage, then and only then do we swing the bat…
Let’s talk about such a pitch on the Dow.
First of all, is there any reason in the last month or so to think about anything other than long positions being the higher probability of the Dow? No, in fact, the structure of the Dow is very bullish, using moving averages and a tool that I call the JT Trend.
Now, I know that there are gonna’ be some days that are down, but the higher probability side of the Dow is to look for long positions. So, the bell rings and the market immediately starts to go into a pretty sustained and fairly violent move to the downside. Now, for some very astute momentum traders, they’ll get pieces of this. But I want the calmer, simpler pitch where I can scoop up the long position. That’s gonna’ work with the directional bias of this market and that happens in this window right in here (below).

Notice that the V Score, a volume-derived tool, measuring standard deviation starts to bottom out. You can see aggressive to conservative. In fact, we have one conservative signal right here telling us that this area is starting to bottom out. Then we get a Darius signal corresponding with that score, so I have a price-based indication of exhaustion and I have a volume-based indication of exhaustion within about 10 minutes of each other.
When those two can overlap I can take advantage of bearish momentum. Here’s a nuance of this one, notice that this was just a little out of sync. They weren’t aligning on the same bar, but you think, “Wait, is there a buying opportunity here?” Well, there is…
This is where I’ll look at an option in one of the Dow related sectors. This could be the Dow Index ETF itself, it could be the IYT, or it could be the XLY. We can go a little further down and look at XLF and XLV… whatever sectors are heavily weighted within the Dow.
Again, which ones have great daily structure? Whenever there is any kind of weakness, don’t immediately engage a short side of the market. If we’re closing in on the floor, check out the directional bias.
And if the signals aren’t exactly lining up…
Then what you want to do is think about an option in an ETF alternative to be able to handle the volatility until the markets kick back up again. This is what we’re looking at (below).

There are a number of ways to look at this. One way is we had about a 20-point zone of uncertainty which is $100 of risk per contract in terms of where I would build the trade. Then ultimately this was a trade that went up basically 95 points (below).

This would be 95 x 5 per point. so you can see it’s a pretty nice little trade here and that would be per contract. This would be $475 per contract or you can typically look at the DIA, IYT XLI, and usually those options will be under $2 per option. It’s a very affordable way to take advantage of the ETF alternative. And why would I think about the ETF alternative?
Because we’re getting a buy signal, but they’re not quite aligned and these are the kinds of things that I’ll look at where I won’t get sucked into the shore. I’ll follow the directional bias and take a nice buy for a nice simple win going right into midday. Or I can take the trade and I won’t worry about what’s gonna’ happen in the afternoon. In fact, I’m not even interested.
Nice morning trade, call it a day, put some money in my account, and then start fresh the very next session.
