

One of the main aspects so many traders overlook is volume. Where is the money going? Are people interested in buying or selling this instrument?
Most indicators are price-based. This means most traders are overlooking volume as part of their analysis.
For the traders who do utilize volume as part of their analysis…
Here’s a Countdown Fun Fact many don’t think about:
Most VWAP (Volume Weighted Average Price) tools are “rolling.”
This means there is no way to calculate volume from a specific date or time going forward using a common VWAP tool.
For this reason, to make a VWAP more effective, I use an anchored VWAP.
I start with a 10-day anchored VWAP and a 1st-of-the-month anchored VWAP. These two levels are always on my charts on the daily time frame. For day trading, I anchor specific key times — 2 a.m., 7 a.m., and 9:30 a.m.
Let’s look at an example of what an anchored VWAP will show you.
In this example, the NASDAQ opened below both anchored VWAP points —that is bearish sentiment.
Notice the red GRaB (green, red, blue) candles.
If you’re wanting to day trade that could be a shorting opportunity.
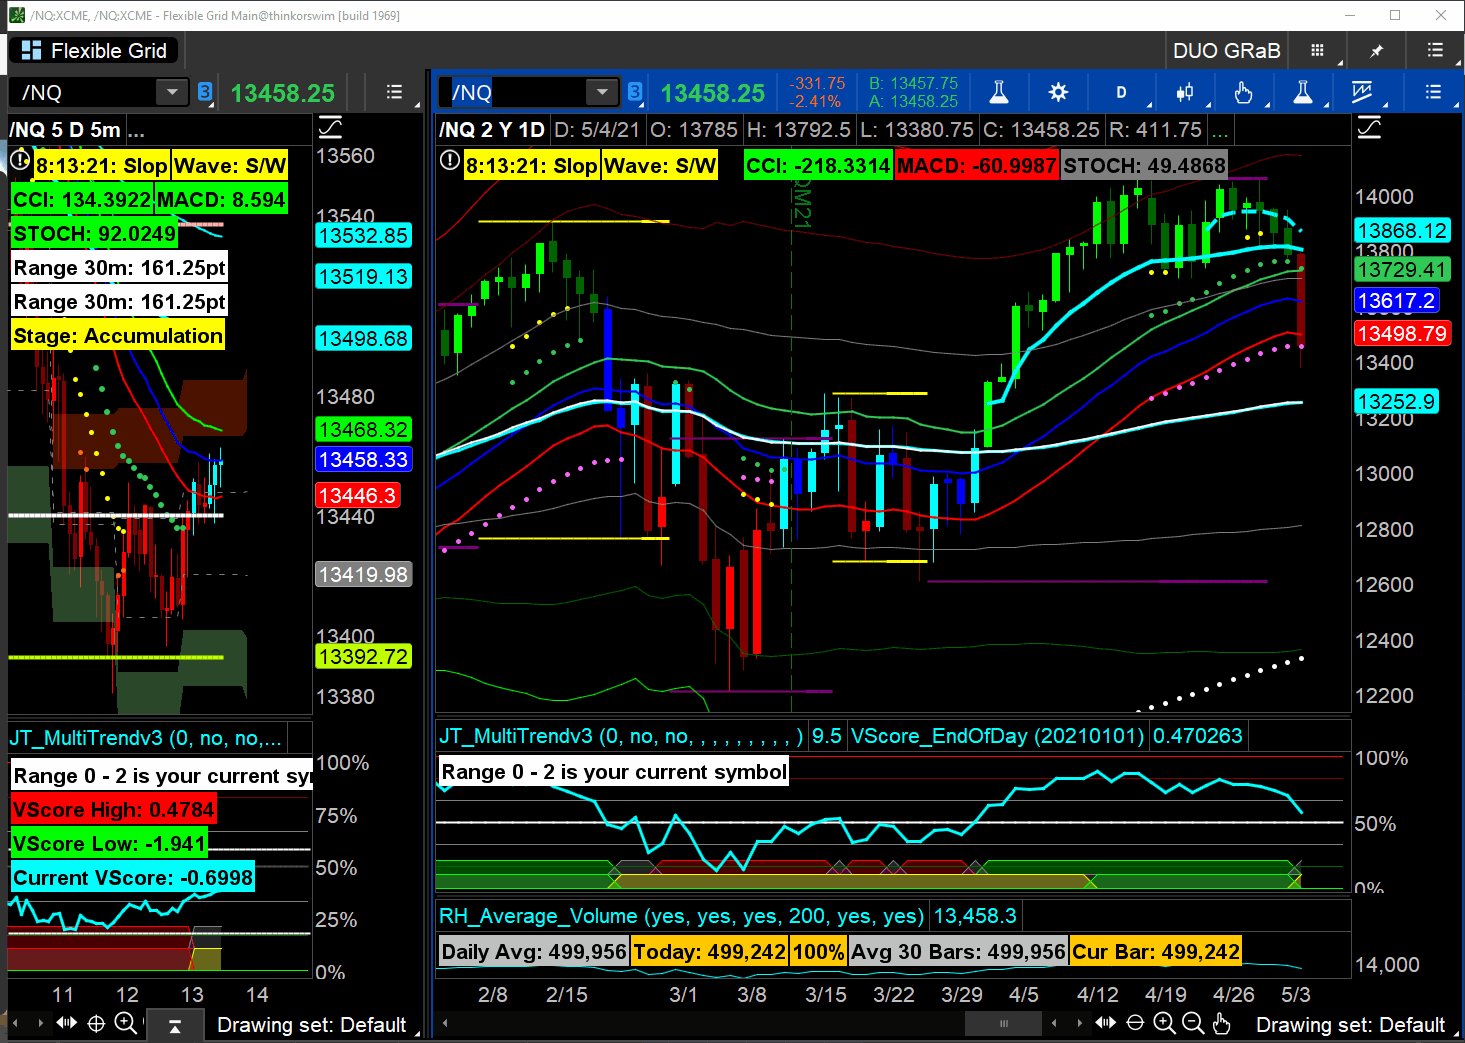
Being the NASDAQ opened below both of the anchored VWAP points, there is a higher probability of weakness.
Let’s look at another example, Amazon.
Anchored in the same places are the 10-day anchored VWAP and a 1st-of-the-month anchored VWAP. Remember these are always on my charts. Amazon (like the NASDAQ) opened below both anchored VWAP points —that is bearish sentiment.
When you see red candles below the light blue solid line, and you’re going to think about day trading shorts, that’s where you would think about it.

If you’ve opened below the anchored VWAP (as the NASDAQ and Amazon did) and you’re looking for somewhere to short the market, that’s a pretty good place to start using these volume weighted studies.
Anchored VWAP is only one part of the volume analysis tools that I use. For today we are focusing on the anchored VWAP.
The anchored VWAP is also an essential tool to use for major events such as earnings, central bank events, or minor low/high patterns. These are of key importance with day trading.
The idea behind the VWAP is that there are levels that are not going to be identified by price-based indicators and calculations. That means there are levels on a chart that will be important but will not be visible with traditional support, resistance, trendlines, and indicators that do not factor in volume.
Most traders and investors have no idea these levels exist. These levels are identified because of volume. Volume-prioritized price levels are what the VWAP tools discover and that is their edge. These tools will complement the indicators you are already using. Combine the VWAP tools to find levels you wouldn’t otherwise notice.
I did an entire class dedicated to volume and understanding how to identify volume by looking beneath the surface. Find the class here…
